Security awareness metrics that matter are the ones that show behavioral change and risk reduction, not just that people finished a module. They centre on reporting rates, dwell time, repeat-clicker improvement, and real incident reporting so you can see whether your security awareness program is actually reducing breach likelihood and strengthening your cybersecurity posture.
The point of measuring is to steer a broader human risk management program.
100% completion looks good in a report. It checks the box for compliance, but does it actually reduce risk? Most enterprises are still fixated on completion and click rates because they’re easy to pull and easy to explain. Those numbers prove activity, not outcomes and they can mask the reality that nothing’s changing despite running regular training.
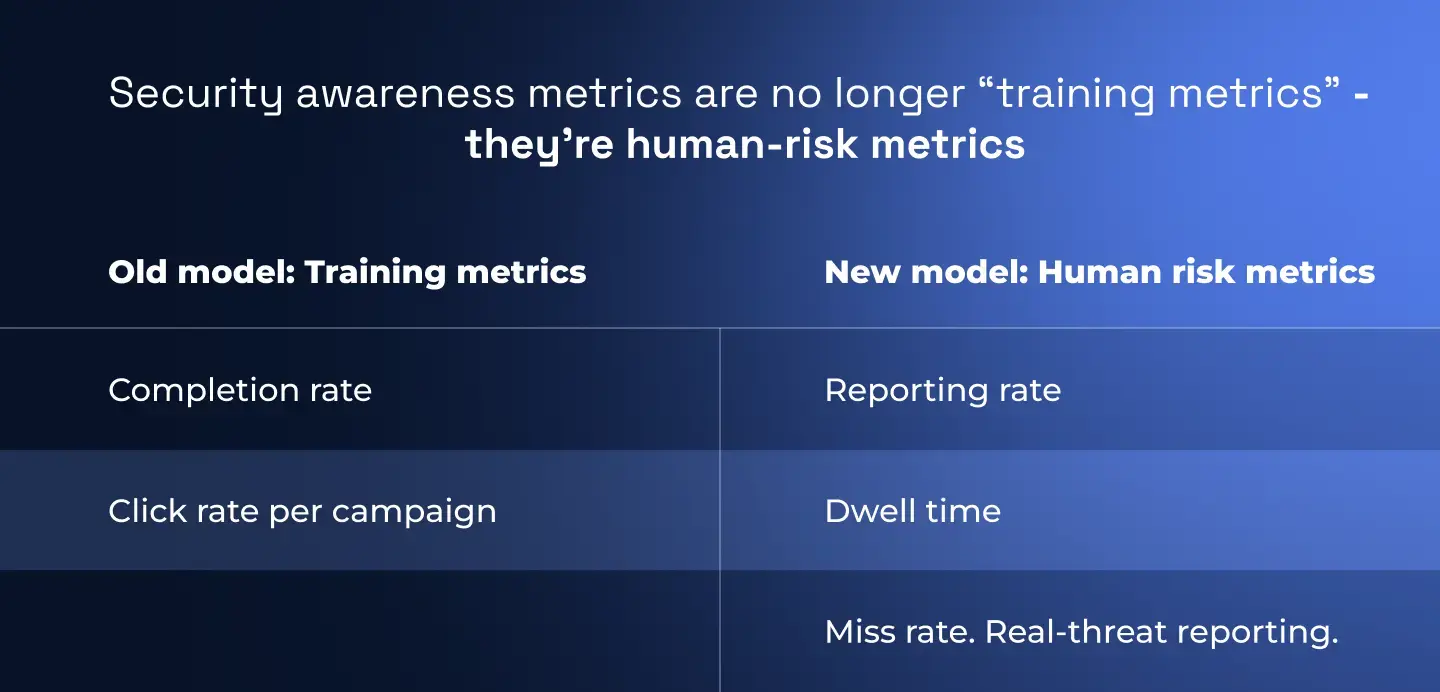
The shift underway is toward human risk metrics: ongoing engagement, reporting rates, repeat-clicker reduction, and faster reporting of real threats, all visible at the individual and team level.
This is also why the two approaches generate such different amounts of evidence: Hoxhunt’s 2026 data shows a completion-based program yields roughly 4,000 behavioral data points a year, versus about 180,000 for a behavior-change program (Hoxhunt Phishing Trends Report 2026). That gap is exactly what lets human-risk metrics show whether behavior is actually changing, where completion rates cannot.
Throughout this guide, we’ll treat security awareness metrics as a risk management tool, not an optics exercise - showing how to align behavioral KPIs with business objectives, NIST expectations, and executive reporting so you can actually predict (and drive) breach reduction.
Prefer to listen? We discussed what organizations are getting wrong about measurement and what the most mature programs are doing instead on the All Things Human Risk Management Podcast. This conversation cuts through outdated KPIs and explores what actually signals behavioral change.
What are security awareness metrics?
Security awareness metrics are the signals your security team uses to understand how employee actions affect cyber risk - whether people actually spot, report, and resist real attacks. Ideally they should go beyond training completion and phishing click rates to include reporting behavior, dwell time, engagement coverage, and culture indicators that map directly to breach likelihood.
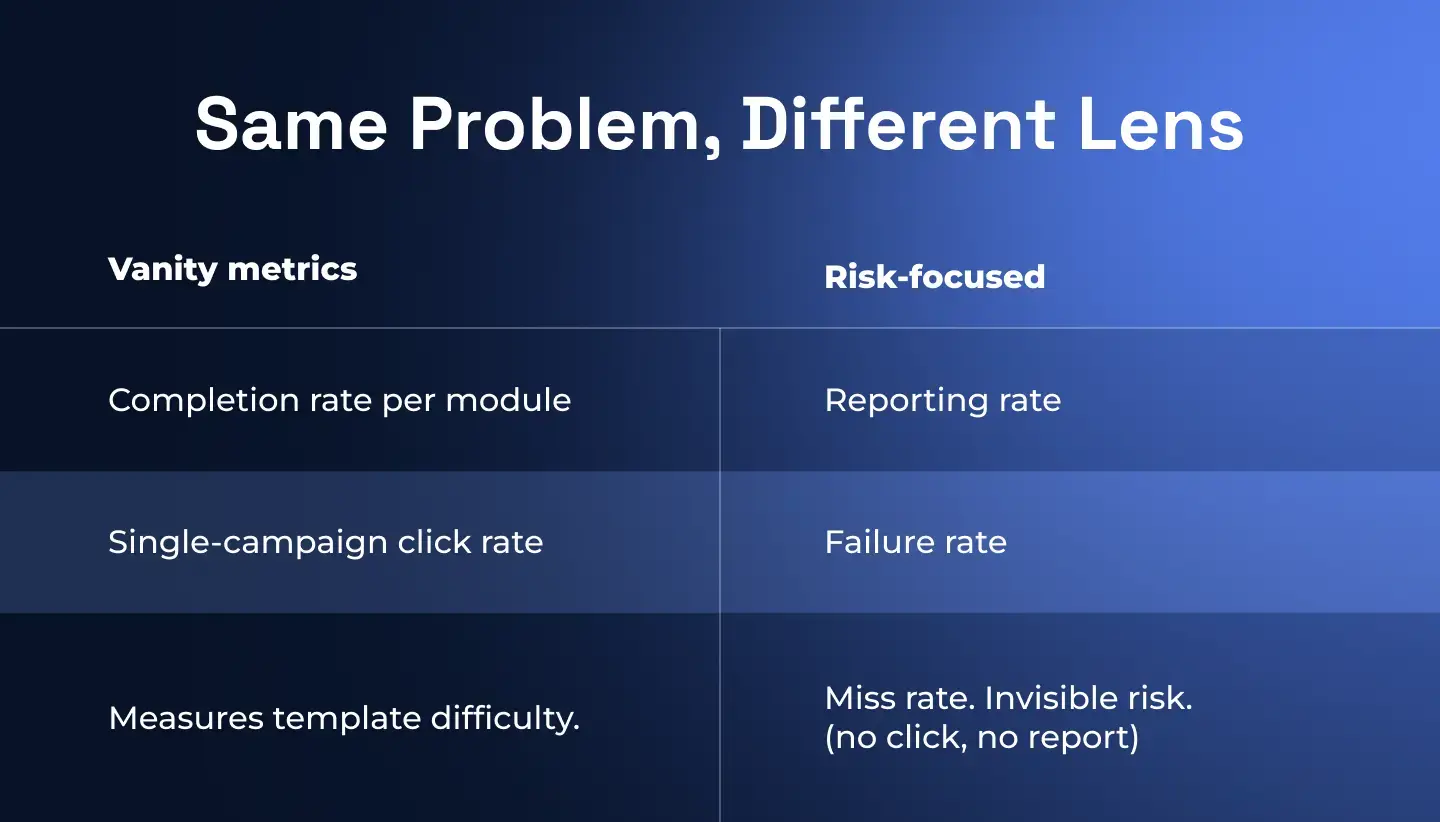
In most organizations, “security awareness metrics” still means LMS completion rates + phishing failure (click) rates. Those are easy to export and easy to stick on a slide but they mostly prove that people received a security training module, not that your security culture or cybersecurity posture improved. Completion rates should be an input, not an outcome: it measures who took the training, not what changed afterwards.
Traditional phishing campaigns lean on failure rate per campaign (click rate) and pass rate as the primary indicators of success.
However...
- Failure rate is volatile and easy to game by changing difficulty. A “low” rate usually just means the simulations were easy, not that behaviors improved.
- Pass rate is even more misleading: if someone ignores the email, they’re counted as a success, even if they’d fall for the same attack in the wild.
Failure rate can be useful but only as useful only in a very specific context: personalized, frequent, role-relevant simulations where difficulty is tuned per person.
A working definition: from “did they finish?” to “will they protect us?”
When we talk about security awareness metrics that matter in an enterprise program, we’re really talking about three layers of measurement:
- Engagement & coverage metrics: who is actually participating?
- Behavioral & risk metrics: how do people act when faced with phishing simulations and real social engineering attacks?
- Culture & sentiment metrics: how do people feel about security responsibilities and the security team?
A metric is worth tracking if it helps you answer “Are employees making safer decisions around digital assets, privileged accounts, and attack vectors and is our risk rating going down?”
Security awareness metrics that go beyond click rates
You can think of modern security awareness metrics in four buckets...
1. Engagement & coverage
These tell you whether your security awareness program is actually reaching people across business units, inCISO reporting lines, and senior management.
- Average simulation reporting rate per employee – % of users who correctly report a phishing simulation. At Hoxhunt, we recommend aiming for ≥70% as a benchmark for strong coverage.
- Miss rate: % of users who neither click nor report. This exposes invisible risk: people you can’t classify as safe or unsafe because they never interact.
- Training frequency: how often individuals receive security awareness training, phishing simulations, or micro training nudges, rather than a once-a-year security training module.
2. Behavioral & incident-linked metrics
These are the behavioural metrics that actually connect employee actions to incident response and breach reduction.
- Reporting rate (simulations): a primary metric in our model at Hoxhunt. It measures positive behavior (spot + report) rather than failure.
- Real threat reporting rate: % of real phishing campaigns and social engineering attacks that employees report via the phishing button instead of ignoring or falling for them.
- Average dwell time: time from a phishing email landing to the first user report. Shorter dwell time = faster detection and more time for the SOC to contain attacks before wider spread.
- Repeat-clicker reduction: how many phishing repeat offenders improve over time after just-in-time training and behavioral science-informed nudges.
- Behavior change trend: per individual / team: how reporting, failure, and miss rates evolve as simulations get harder and more varied in attack vectors.
3. Content & difficulty calibration metrics
Because failure and reporting rates are heavily influenced by how realistic and tailored your phishing campaigns are, treat these as part of your metric set too.
- Difficulty alignment: are simulations calibrated to each user’s skill level so metrics reflect real capability, not “gotcha” tricks or trivial tests?
- Variety of content: are simulations and training modules covering current threat landscape techniques (QR phishing, MFA fatigue, AI-written emails) and role-specific tools.
- Timing & frequency settings: are tests random and realistic, or do employees get advance “heads up” that a phishing campaign is coming, artificially inflating success?
4. Culture & sentiment metrics
Finally, awareness metrics aren’t just numbers...
- Cybersecurity sentiment: survey-based scores on whether employees find training useful, understand their security responsibilities, trust the security team, and feel psychologically safe reporting mistakes.
- Qualitative feedback: focus groups and anecdotes that explain why metrics look the way they do (e.g. low reporting rates tracing back to fear of punishment or confusion about which email filters/protocols to trust).
Key takeaway: Security awareness metrics are no longer just “training metrics.” They’re human-risk metrics that integrate into your broader risk management and incident response picture. When you present them to executive management, you’re not saying “90% completed our security awareness training”; you’re saying “70%+ of our people are actively shielding the organization by spotting and reporting threats quickly... and here’s how that’s cutting dwell time and reducing our security score breakdown exposure.”
What is a phishing simulation? And how to use them as your behavior change engine
A phishing simulation is a controlled fake phish sent to employees to see whether they spot, report, or ignore it. At this point, most teams run simulations; the real differentiator is what you measure from them and whether they’re tuned to change behavior.
What most teams miss about phishing simulations
- Plateau and template learning: Security leaders complain that training “plateaus” after about a year because users simply learn the templates. They recognise your phishing style, not attackers’ styles. Metrics look stable or even “good” while actual resilience stalls.
- Measurement noise from tooling: We've heard of QR-code phishing test showing a “1000% open rate” because Microsoft rewrote URLs, completely skewing the results. The simulation looked like a disaster on paper, but the metric was garbage. If you don’t understand how email filters, link rewriting and URL checks interact with your sims, your numbers lie.
- Admin and template-centric design: Many tools are “set it and forget it”: manual campaigns, static templates, fixed schedules. That leads to sporadic, predictable sims that give you a snapshot, not a trajectory and leave you blind to how individuals and teams actually improve over time.
All three issues have the same outcome: you can’t trust the metrics coming out of the program, even if the phishing simulations themselves exist.
Design principles for simulations that generate useful metrics
- Adaptive difficulty instead of one-size-fits-all: The system should automatically adjust lure difficulty per person based on their history (repeat clicker, strong reporter, disengaged, etc.). That way, trends in behaviour are meaningful instead of just reflecting how easy last month’s template was.
- Role and tool-relevant scenarios: Finance sees invoice fraud and vendor-bank-change scams. Exec support sees travel and calendar lures. Developers see code/repo and SaaS-admin phish. Generic “password expiry” emails tell you less about real risk than simulations mapped to actual workflows.
- Integrated, single-click reporting: One clear “report phishing” button, wired into your SOC/IR flow, so simulations train the same muscle employees need for real incidents -and so you can use the data operationally, not just for awareness vanity metrics.
- Immediate, lightweight feedback: Short, contextual micro training after a report or failure, not a 60-minute detention over lunch. The goal is to keep psychological safety high so people keep reporting, including when they think they might have messed up.
NIST guidance on security training programs
NIST guidance on security training programs centres on a lifecycle: design, develop, implement, then evaluate awareness and training for effectiveness - not just log completions.
This aligns with behavioural metrics like reporting rate, dwell time, and human-risk trends, instead of stopping at “we delivered the module.”
What NIST actually expects from awareness & training
NIST SP 800-50 and its updated 800-50r1 describe a full program lifecycle:
- Program design: define goals, audiences, and risks.
- Material development: build awareness and role-based training content.
- Implementation: deliver campaigns and training to the workforce.
- Post-implementation: evaluate results and adjust.
800-50 explicitly separates awareness (broad culture shift) from training (role-based skills) and calls out the need for metrics in the post-implementation phase to judge effectiveness, not just activity.
NIST SP 800-53’s Awareness & Training (AT) controls reinforce this:
- AT-2 – Literacy training & awareness: provide training initially and at an organization-defined frequency, and refresh when systems or risks change.
- AT-3 – Role-based training: tailor training to specific roles and incorporate lessons from internal or external incidents.
- AT-4 – Training records: document and monitor awareness and role-based training activities over time.
NIST is essentially saying: make training risk-based, role-aware, and continuously evaluated. Completion logs are necessary, but nowhere do they claim completions alone prove risk reduction.
For formal guidance, see NIST SP 800-50 Rev.1 - Building a Cybersecurity and Privacy Learning Program
Behavioral and reporting-based KPIs
Behavioral and reporting-based KPIs are where your metric stack turns into decisions. Below we'll narrow down a small set of KPIs that drive action: what “good” looks like, how to read movement, and what to change when the numbers shift.
1. Choose a small decision set (not a wall of charts)
Teams that move the needle don’t show leadership 20 charts - they standardize on a short list of behavioral and reporting KPIs that everyone recognizes.
A pragmatic “decision set” for enterprise programs:
- Reporting rate (simulations): your primary behaviour KPI.
- Real-threat reporting rate: proof that sim habits transfer to live attacks.
- Average dwell time: how fast users expose attacks to SOC.
- Miss rate: exposes who you’re not reaching.
- Repeat-clicker reduction: shows whether interventions work on high-risk users.
Everything else (content mix, completion, quiz scores) is context for the security team - not the KPI set you optimize and report upwards.
2. Set targets anchored in behaviour, not vanity
You don’t need perfect industry benchmarks; you need clear directionality and a couple of simple anchors that leadership can remember.
Simulation reporting rate:
- Aim for an average reporting rate ≥ 70% per employee as a sign that most people are actively spotting and reporting simulations.
- For execs: “Above ~70% reporting, the odds of people quietly missing attacks drop; they’ve built the habit of acting, not just ignoring.”
Real-threat reporting rate:
- Treat it as a trend metric: month-on-month increase is good, especially if it tracks with increased simulation reporting and awareness campaigns.
- Make the story explicit: “We care less about perfection and more about more real phish getting to the SOC earlier.”
Dwell time:
- Anchor to your own baseline. “We cut phishing dwell time from seven to two hours.”
- Internally, you can frame targets as “halve median dwell time in 12 months” rather than “hit X minutes,” because the baseline is org-specific.
Miss rate:
- Treat >30-40% miss on key cohorts as a risk trigger: that’s a big chunk of people giving you no behavioural signal on phish.
- Your goal is to push this down over time through better comms, single reporting routes, and more relevant content - not to zero, but to a level where you trust your visibility.
Repeat-clicker reduction:
- Working with Hoxhunt, a behaviour-focused program made users six times less likely to click and seven times more likely to report compared to a legacy program.
- You can turn that into a target pattern: “For high-risk cohorts, we expect to see a meaningful drop in failure and a sharp rise in reporting within 3-6 months of intensified coaching.”
You’re not promising those exact ratios; you’re showing leadership the shape of success.
3. Turn KPI movement into playbooks
For each KPI, you want a “when X happens, we do Y” pattern. That’s what keeps this section from duplicating earlier taxonomy content.
Here’s a compact mapping you can use:
4. Package KPIs as a narrative, not a dump
Boards and execs don’t care about isolated cyber metrics; they care about stories with numbers that tie to business risk.
A clean way to frame behavioural & reporting KPIs in board packs:
Lead with trajectory: “In the last 12 months we increased sim reporting from 52% → 71%, and cut median dwell time from 6h → 2.5h.”
Tie it to real incidents: “In that window, employees reported 4 major phishing campaigns before they reached high-risk groups; none resulted in compromise.”
Show what you changed: “We shifted from completion metrics and annual courses to adaptive simulations plus micro-training; here’s how we targeted repeat clickers and high-risk roles.”
Same metrics, different job: they stop being a scoreboard and become evidence that your program is systematically reducing human-driven risk.
Best practices to align metrics with business goals
Security awareness metrics align with business goals when you stop treating them as proof that “training happened” and start treating them as proof that you’re enabling the company’s strategy while reducing human cyber risk. That means framing everything in terms of risk reduction, business outcomes, and experiments that show impact.
1. Start from strategy, not from the LMS
Your job is not to maximize completions; it’s to enable your organization’s strategy by reducing the human risk in cybersecurity.
So you start with questions like:
- What is the business trying to do this year? (e.g. scale AI usage, push more digital self-service, expand into new markets)
- Where does human behaviour make those goals fragile? (e.g. unsafe use of AI tools, weak access hygiene for new apps, poor reporting culture in new regions)
Then decide which human-risk metrics matter. For example:
- If the strategy is “safe AI adoption,” executives care that employees use AI tools safely while avoiding data leaks - not that they passed an AI training quiz.
- That maps to behavior metrics like reporting suspicious prompts, following data-handling guidance, and not pasting sensitive content into unapproved tools, rather than a generic “AI module: 100% complete.”
2. Translate goals → behaviours → metrics
The move Maxime describes is: compliance is necessary, but it’s only one slice; your real goal is risk reduction in support of strategy.
You can formalise that as a simple chain:
Business goal: e.g. “grow digital sales by 20%,” “roll out AI copilot,” “migrate customers to online banking.”
Key human behaviours: what must people do differently for that to be safe? (report phish quickly, use MFA correctly, handle customer data properly).
Metrics that reflect those behaviours:
- Reporting rate and dwell time for high-risk customer-facing teams.
- Miss rate and sentiment in new regions or units critical to the strategy.
- Repeat-clicker reduction among privileged admins or AI “power users.”
If you can’t draw a straight line from a metric to either business enablement or risk reduction, it’s probably a vanity metric.
3. Keep compliance metrics, but demote them
You don’t throw away completion; you reposition it. Completion doesn’t tell much except for proving compliance and can create a false sense of security if you report only that.
Best practice is:
- Treat completion rate + training records as evidence you met regulatory and audit obligations.
- Treat behavioural metrics (reporting rate, dwell time, real-threat reporting, cross-channel scores) as evidence that you’re actually reducing human cyber risk.
If you didn’t hit 100% completion, would your cybersecurity risk actually increase beyond the legal risk?
4. Prove impact with small experiments, not big promises
You don't have to ask leadership to just believe in behavioural metrics, run an experiment and show the deltas.
Pattern to copy:
- Take a test group and put them on an enhanced, behaviour-focused program (frequent, tailored phishing, just-in-time micro-training).
- Leave a comparable group on the legacy compliance program.
- After several months, send the same phishing simulation to both.
- Measure: Failure rate (clicks), reporting rate, dwell time.
Run interventions, measure behaviour change, tell a business-risk story with the before/after numbers.
5. Present metrics in business language, with stories
When you walk into a board or risk-committee meeting, use their language and their problems, not yours.
- Avoid techy metric dumps: Don’t lead with “reporting up 12.3%, dwell time down 37%.” Start with: “We materially reduced the window attackers have to do damage, from hours to minutes, in the teams that matter most.”
- Mix numbers with specific stories: Combine data with incidents and competitor examples rather than generic statistics.
- Use quotes from your own people: Hoxhunt's Bird & Bird case is telling: the CISO’s “favourite metric” was that people love the program - staff ask for more simulations, worry about missing them on leave, and bring that enthusiasm back to the board as culture evidence.
A board-level slide aligned to this mindset looks more like:
- “We cut phishing dwell time from 7 hours → 2 hours in high-risk teams.”
- “Employees in the new program are 6x less likely to click and 7x more likely to report the same attack.”
- “People are asking for more training and using the button for real incidents - here’s what they’re saying.”
That directly addresses the question execs actually have: “Is this making us safer while we pursue our strategy?”
Choosing metrics for executive reporting
NIST, auditors, and internal process owners still need proof that training happened. That’s why completion is so entrenched: it’s easy to export, easy to explain, and executives are used to seeing one simple number on a slide. But completion is an input, not an outcome, all it really tells you about is compliance.
Meaningful metrics as those that capture behavior and incidents: engagement over time, reporting rates, repeat-clicker reduction, behaviour change at individual/team level, and how quickly people report real threats.
Front page: human-risk metrics; appendix: compliance
For exec packs, keep a clear separation:
Headline / first slide (human risk):
- Reporting rate (simulations, plus a view on real-threat reporting)
- Median dwell time for phish (sim + real) as a “great measure of actual risk reduction”
- Trend in high-risk cohorts (repeat clickers shrinking, behaviour improvement over time)
Supporting / audit pack:
- Completion rates, quiz scores, training hours
- Control mappings (NIST/ISO) and any required “% trained” attestations
Use experiments as core evidence
- Design a small experiment (test vs control).
- Measure reporting, dwell time, click rates on a common simulation.
- Put the deltas next to a short narrative about what changed.
Executives don’t need the full metric catalogue; they need one or two before/after results that tie training changes to reduced breach likelihood.
Tell a business story, not a metric dump
- Start from what they care about, not what you care about. Use business language, not security jargon.
- Combine figures and stories, never just one or the other.
- Use concrete incident or competitor examples instead of abstract global statistics.
Keep the metric set small, but not singular
Execs often cling to completion because it’s a single, stable number. You may be temptated to replace it with a single “human risk score,” but that composite scores hides what’s actually improving or degrading underneath.
Here's what to do instead:
- Present a small mix of behavioural metrics (reporting, dwell time, repeat-clickers) and incident/culture data, rather than one opaque index.
- Keep that set stable over time so continuity concerns are addressed, even as you move away from completion as the primary success measure.
Frame metrics as strategy support, not just cyber hygiene
Tie executive reporting back to business goals. Your exec metrics should explicitly connect to current strategic themes.
- “These reporting and dwell-time trends show that as we roll out X, employees are faster at spotting and escalating suspicious prompts or emails.”
- “In our highest-risk client-facing teams, repeat clickers have dropped and incident reporting is up, which reduces the chance of an embarrassing, billable outage.”
Completion stays as a compliance checkbox, while exec reporting centres on a small, story-backed set of behavioural and reporting metrics that directly evidence risk reduction.
How to get started with security awareness metrics that actually reduce breaches
You don’t need a reinvention project to fix your metrics. You need a baseline, one good experiment, and a shift from content first to “behavior + empathy first. Start small, measure hard, then scale what works.
Step 1: Capture a reality baseline (4–6 weeks)
Before you improve anything, freeze where you are. Use the metrics you already introduced earlier:
- Simulation reporting rate and average reporting rate per employee
- Dwell time for simulations and any real threats you can measure
- Miss rate (no click, no report) by BU/role
- Completion rates (for compliance only)
- Engagement / sentiment signals - quick pulse on whether training feels useful or just like a checkbox
This is your “season 1” snapshot. Don’t try to spin it - your future story depends on this being honest.
Step 2: Fix the experience, not just the numbers
Metrics stagnate when training is generic, punitive, and badly timed. The fix is rooted in how people experience the program:
- Make training small, frequent, respectful: move from annual/quarterly marathons to short micro-interactions spaced in the flow of work.
- Lead with empathy and relevance: start from users’ tools, roles, and pressure, not what security wants to say.
- Drop punitive patterns: no “detention” lunch sessions for people who fail a phish; that kills engagement and leads to gaming (e.g. reporting everything just to avoid punishment).
You’re laying ground for metrics to move by removing the stuff that makes people opt out mentally.
Step 3: Run one serious experiment
- Pick a test group and leave a similar group as control.
- Give test group: Adaptive phishing simulations (difficulty adjusts per user), micro-training in the flow of work and positive, gamified reinforcement.
- After ~6 months, send the same phishing simulation to both groups.
- Compare only three things: failure rate, reporting rate and dwell time.
If you don’t see meaningful deltas, your content / cadence / UX isn’t strong enough yet. If you do, you’ve got the core of your story.
Step 4: Wire metrics into incident response and reporting routes
If people don’t know where or how to report, or there are too many routes, your metrics and your incident response both fall over.
Concrete moves:
- Standardize one report-phishing button wired straight into SOC / IR.
- Auto-acknowledge every report (sim + real) so people feel heard.
- Tag confirmed malicious emails to compute real-threat reporting rate and real-world dwell time, not just sim numbers.
Now your “security awareness metrics” are literally feeding operational decisions, not just dashboards.
Step 5: Lock in a minimal executive pack
Once the experiment data comes in, you don’t overcomplicate it. A credible exec pack can be built from:
- One experiment slide: “Enhanced cohort is 6× less likely to click and 7× more likely to report the same phish than legacy cohort.”
- One risk movement slide: “Median dwell time dropped from X → Y hours in high-risk teams.”
- One culture slide: a couple of real quotes from staff about how the training changed their behaviour (“I would have clicked this before…”).
Step 6: Iterate: experiment, measure, adjust
There’s no final steady state. You experiment, measure, adjust.
Your loop:
- Spot a weak signal (plateau in reporting, high miss rate, engagement drop).
- Change something small but concrete (scenario relevance, cadence, tone, UX).
- Watch behavioral metrics + sentiment for 1–2 cycles.
- Keep what moves the needle; drop what doesn’t.
You end up with a metrics framework that isn’t just “NIST-compliant” on paper; it actually shrinks attacker dwell time, increases real-threat reporting, and steadily converts repeat-clickers into defenders - which is the only definition of “metrics that matter” that holds up under scrutiny.
About Hoxhunt: Measurably reduce human cyber risk, at scale
Hoxhunt is a human-risk platform for enterprises that want security awareness training that shows real behavior change, not just course completions.
What Hoxhunt does
- Runs adaptive phishing simulations that automatically tune difficulty per user (harder for strong performers, easier for those struggling).
- Delivers micro-training in the flow of work instead of long annual courses.
- Uses a single, clearly visible “report phishing” button to standardise how employees escalate suspicious emails.
- Gives employees instant feedback when they report - especially on real threats - so the “see → report” habit sticks.
- Adds light gamification (stars, streaks, leaderboards) to keep people coming back without punishment or shaming.
How it’s different from legacy security awareness training
- Designed around people and their roles, not just policies and generic content.
- Explicitly non-punitive: no detention-style remedial sessions for failures.
- Built to adapt over time as the threat landscape and user behaviour change, not “set-and-forget” campaigns.
Below you can see exactly what the reporting dashboard looks like within the Hoxhunt platform.
Security awareness metrics FAQ
Do completion rates still matter?
Yes - but only as compliance proof, not as a success metric. Completion is an input: it shows who took training, not whether behaviour changed. Over-relying on completion creates a false sense of security: you can hit 99% and still see no drop in incidents.
Should we still track phishing click rate?
Track it, but stop treating it as your headline KPI. Click rate is overused and easy to manipulate by changing template difficulty and focuses on failure, which drives punitive culture. Click rate becomes context for scenario calibration, not the story.
What’s a “good” reporting rate?
Aim for at least ~70% average simulation reporting rate per employee. Above ~70%, most of your people are actively spotting and reporting threats; below that, large parts of the org are still invisible from a behaviour standpoint. Treat 70% as a directional benchmark, then focus on quarter-on-quarter improvement.
How long until we see real behaviour change in the metrics?
Expect months, not weeks. Early signs show up as: More people talking about security and asking questions and a spike in incident and sim reporting, including false positives.
What should we do with repeat offenders?
Default stance: fix experience and relevance, not punishment. Three common anti-patterns: school-style training, generic content, and punitive follow-ups that drive disengagement.
Instead, tailor simulations and micro-training to the user’s role and tools, let difficulty adapt (down if someone is struggling, up if they’re cruising) and track repeat-clicker reduction and time-to-recovery (how quickly they move from failure to consistent reporting). The KPI is improvement over time, not zero failures.
Sources
NIST SP 800-50 Rev.1 - Building a Cybersecurity and Privacy Learning Program - NIST
NIST SP 800-53 Rev.5 - Security and Privacy Controls for Information Systems and Organizations - NIST
Recognize and Report Phishing - CISA (Cybersecurity and Infrastructure Security Agency)
Phishing attacks: defending your organisation - UK NCSC (National Cyber Security Centre)
Cybersecurity Culture Guidelines: Behavioural Aspects of Cybersecurity - ENISA
2025 Data Breach Investigations Report (DBIR) - Verizon
Get more cybersecurity insights like this
- Subscribe to All Things Human Risk to get a monthly round up of our latest content
- Request a demo for a customized walkthrough of Hoxhunt