A good phishing failure rate is 5-10% for a mature security awareness program in 2026. Expect 25-35% with no training, 10-20% early on, and 2-5% in highly mature, behavior-focused programs. The number only means something next to reporting rate and simulation difficulty, which is where most benchmark comparisons fall apart.
You can only read a rate against a program you can describe. If you are still setting yours up, the guide on security awareness training effectiveness runs from baseline to behavior change.
Phishing failure rate is one of the most misunderstood metrics in security awareness: benchmarks vary widely, simulation difficulty changes results, and a low click rate can sometimes hide real risk rather than reduce it.
In this guide we’ll cover:
- Current industry phishing failure rate benchmarks
- Why comparing averages can be misleading
- Why failure rate must be paired with reporting rate
- What a strong awareness program actually looks like behaviorally
Because the real goal isn’t just lowering a number, it’s reducing human-driven security risk. The benchmarks below tell you where you stand today, and our playbook on how to build a human risk management program covers what it takes to keep them improving.
What is a phishing failure rate?
Phishing failure rate measures the percentage of users who interact with a simulated phishing email during a phishing test.
Phishing failure rate is also called phishing click rate or phish-prone percentage; all three describe the share of users who fall for a simulated attack.
In most awareness programs, this usually means a user:
- Clicks a phishing link
- Downloads a malicious attachment
- Submits credentials on a fake login page
If any of these actions occur, the simulation counts it as a failure.
Simple definition
Phishing failure rate = (Number of users who interact with the phishing simulation)
÷ (Total number of users who received the simulation)
| Metric | Example |
|---|---|
| Users who received simulation | 1,000 |
| Users who clicked or submitted credentials | 80 |
| Failure rate | 8% |
So the phishing failure rate for that campaign would be 8%.
What actions count as failure?
The definition varies slightly across platforms, but most programs count:
| Action | Usually counted as failure? |
|---|---|
| Clicking a phishing link | Yes |
| Submitting credentials | Yes |
| Opening a malicious attachment | Often |
| Replying to attacker email | Sometimes |
Some platforms also track severity levels, where credential submission is considered a more serious failure than simply clicking.
Why the definition matters
One reason phishing benchmarks can be misleading is that different organizations measure failure differently. Some programs count only credential submission, while others count any interaction at all.
That means two companies with the same “failure rate” may actually be measuring very different user behaviors.
What is a good phishing failure rate?
Most security leaders expect a clear benchmark for phishing failure rates.
The reality is that “good” depends heavily on program maturity. Organizations with no training typically see very high click rates, while mature security awareness programs reduce failures significantly over time.
Benchmark data from the Hoxhunt Phishing Trends Report 2026, built on 50 million data points from 4 million users in 125 countries, and independent industry studies puts typical ranges here:
Phishing failure rate benchmarks by program maturity (2026)
| Program maturity | Typical phishing failure rate |
|---|---|
| No training or awareness program | 25-35% |
| Early-stage awareness program | 10-20% |
| Mature security awareness program | 5-10% |
| Highly mature, behavior-focused program | 2-5% |
As a reference point, the standard baseline in traditional SAT programs is roughly 20% of users failing and 70% never interacting at all (Phishing Trends Report 2026), which is why the untrained and early-stage ranges run so high.
These numbers give useful context, but they should be treated as rough benchmarks rather than strict targets.
Real programs traverse these bands. International Game Technology (NYSE: Brightstar), running 11,000+ employees across 100 countries, started “in the 30 percent failure rate range”, squarely in the no-training band, and is now “between a 4-to-6 percent failure rate” (IGT case study). “That speaks to the efficacy of the Hoxhunt program,” says CISO Kevin DeLange.
A company reporting a 5% failure rate might actually have weaker security behavior than one reporting 8%, depending on:
- How realistic the phishing simulations are
- How failure is defined (click vs credential submission)
- How often employees are tested
- Whether employees actively report suspicious messages
This is why benchmarking failure rate alone can create a false sense of security.
For example, the Hoxhunt Phishing Trends Report 2026 shows that with continuous behavior-focused phishing training, failure rates fall from around 20% to 3.4% within the first year, while reporting behavior improves at the same time.
The chart below illustrates this behavioral improvement over time.

But even this kind of improvement doesn’t tell the full story. Failure rate alone doesn’t measure whether employees are actually detecting and reporting threats.
That is the job of Behavior Risk Console.That’s where comparisons and benchmarks can become misleading.
Why comparing phishing failure rates alone is misleading
Benchmark numbers can be useful for context, but comparing phishing failure rates in isolation often leads to the wrong conclusions. Two organizations may report the same failure rate while having very different levels of real risk.
Several factors make direct comparisons unreliable.
Simulation difficulty varies widely
Phishing simulations are not standardized. Some programs send very obvious phishing emails designed mainly for awareness. Others run highly realistic simulations that closely mimic real attacks.
A company running easy simulations may report a 2-3% failure rate, while another running realistic scenarios may report 8-10%, even though the second program may actually be testing users more effectively. Without knowing simulation difficulty, benchmarks can be misleading.
Organizations define “failure” differently
Different programs count different actions as failures. Some organizations count only credential submission, while others count any link click. That means two companies reporting a 5% failure rate may actually be measuring different user behaviors.
Attack surfaces and employee roles differ
Failure rates also vary depending on:
- Industry threat exposure
- Employee roles and email volume
- Organizational size and complexity
- Frequency of phishing simulations
For example, finance teams and executive assistants typically face higher phishing exposure, which can influence simulation results.
The real risk question isn’t just “who clicked?”
A low failure rate might look good in a dashboard, but it doesn’t necessarily mean employees are actively detecting threats. The more important question is whether employees are recognizing suspicious emails and reporting them to security.
If your program’s rate looks good but risk doesn’t feel lower, the fuller diagnosis is in why security awareness training isn’t reducing risk.
That’s why mature security awareness programs evaluate failure rate alongside other behavioral metrics rather than as a standalone measure.
In practice, the most meaningful insight comes from looking at how failure rate changes alongside reporting behavior over time.
Do phishing failure rates vary by industry?
Yes. Threat exposure and role mix move the numbers: finance teams, executive assistants, and other high-email-volume roles consistently run hotter than the organizational average, and heavily targeted industries face more sophisticated attacks. The maturity bands above still hold across industries; what changes is where an organization starts and how fast it improves. Per-industry failure rate baselines and improvement curves are published in the Hoxhunt Phishing Trends Report 2026 industry benchmarks.
Benchmark traps that distort failure rates
Failure rate benchmarks are widely cited in security awareness reports, but they’re easy to misinterpret. Several common “benchmark traps” can distort the metric and make programs appear stronger or weaker than they actually are.
Easy simulations can artificially lower failure rates
If phishing simulations are too obvious, failure rates will drop quickly.
For example:
- Generic phishing templates
- Obvious spelling errors
- Suspicious sender domains
- Poorly designed landing pages
These types of simulations may produce a very low click rate, but they don’t reflect the types of attacks employees actually face.
Real phishing emails are often well-crafted, contextual, and targeted. If simulations don’t match that realism, the failure rate becomes a vanity metric rather than a meaningful risk signal.
Failure rate can be “optimized” without improving behavior
Some programs unintentionally optimize for a lower failure rate instead of stronger security behavior.
This can happen when teams:
- Reduce simulation difficulty
- Test employees less frequently
- Stop testing higher-risk groups
- Focus reporting on campaign-level results rather than behavioral trends
The result is a better-looking metric without meaningful improvement in real-world resilience.
Benchmarks rarely account for simulation frequency
Another hidden variable is how often employees are tested. Organizations that run frequent simulations tend to see higher failure rates initially because users encounter more scenarios.
Over time, however, this approach builds stronger detection habits, which leads to more reliable improvements in behavior. Programs that run only occasional phishing tests may report lower failure rates simply because users are exposed to fewer scenarios.
Benchmark comparisons ignore reporting behavior
Finally, most benchmark reports focus heavily on click rate while ignoring what happens after the email arrives.
But in real-world incidents, the most valuable employee action is often reporting the threat, not just avoiding the click. That’s why failure rate should never be evaluated alone.
Third-party data underscores why reporting rate is the metric that reveals real behavior change: according to the Verizon DBIR 2025, trained users report phishing at roughly 21% versus a 5% base rate, a 4× lift that a click-only failure rate can never capture.
To understand whether a program is actually improving security behavior, it needs to be interpreted alongside another critical metric: phishing reporting rate.
Why failure rate must be paired with reporting rate
A phishing failure rate only tells you who interacted with the simulated attack. It doesn’t tell you whether employees are actively helping detect threats.
That’s why mature security awareness programs evaluate failure rate alongside another critical metric: phishing reporting rate.
Reporting rate measures the percentage of phishing simulations that employees correctly identify and report to security.
- Failure rate: How many users interacted with the phishing email
- Reporting rate: How many users detected and reported the threat
Looking at these metrics together gives a much clearer picture of security behavior.
For example:
| Scenario | Failure Rate | Reporting Rate | Interpretation |
|---|---|---|---|
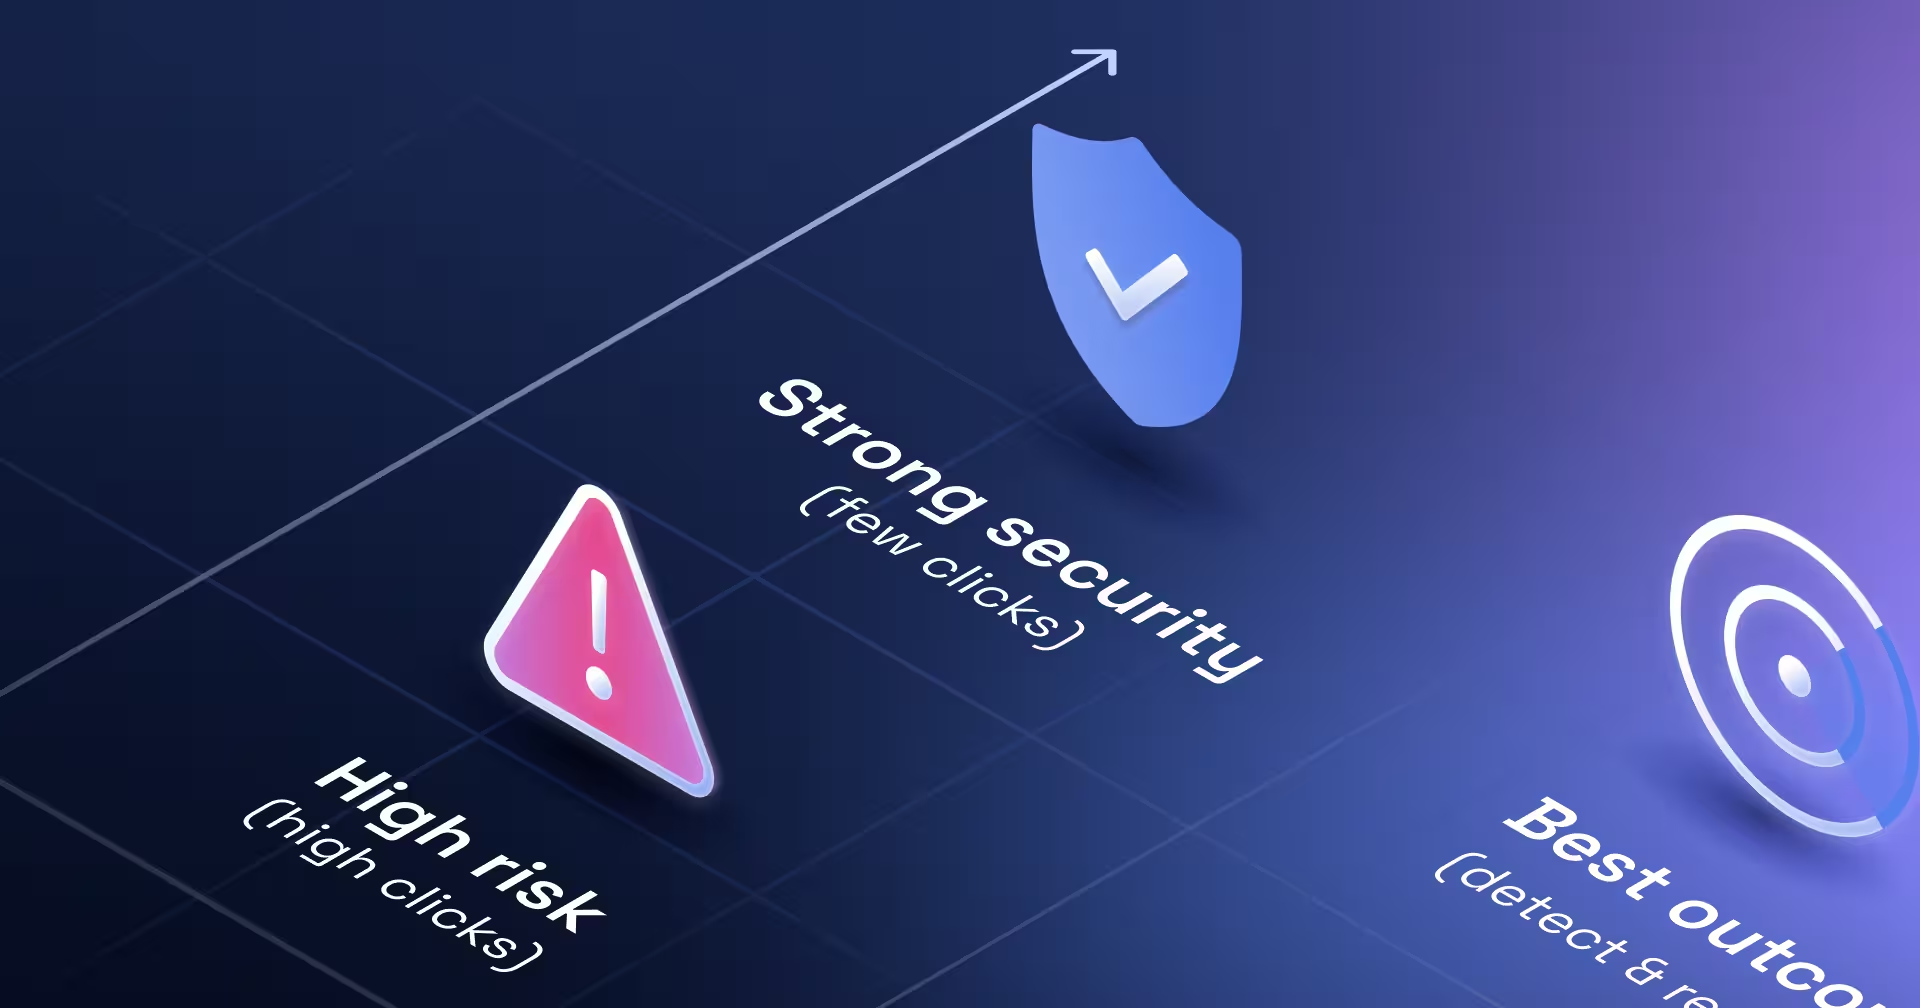
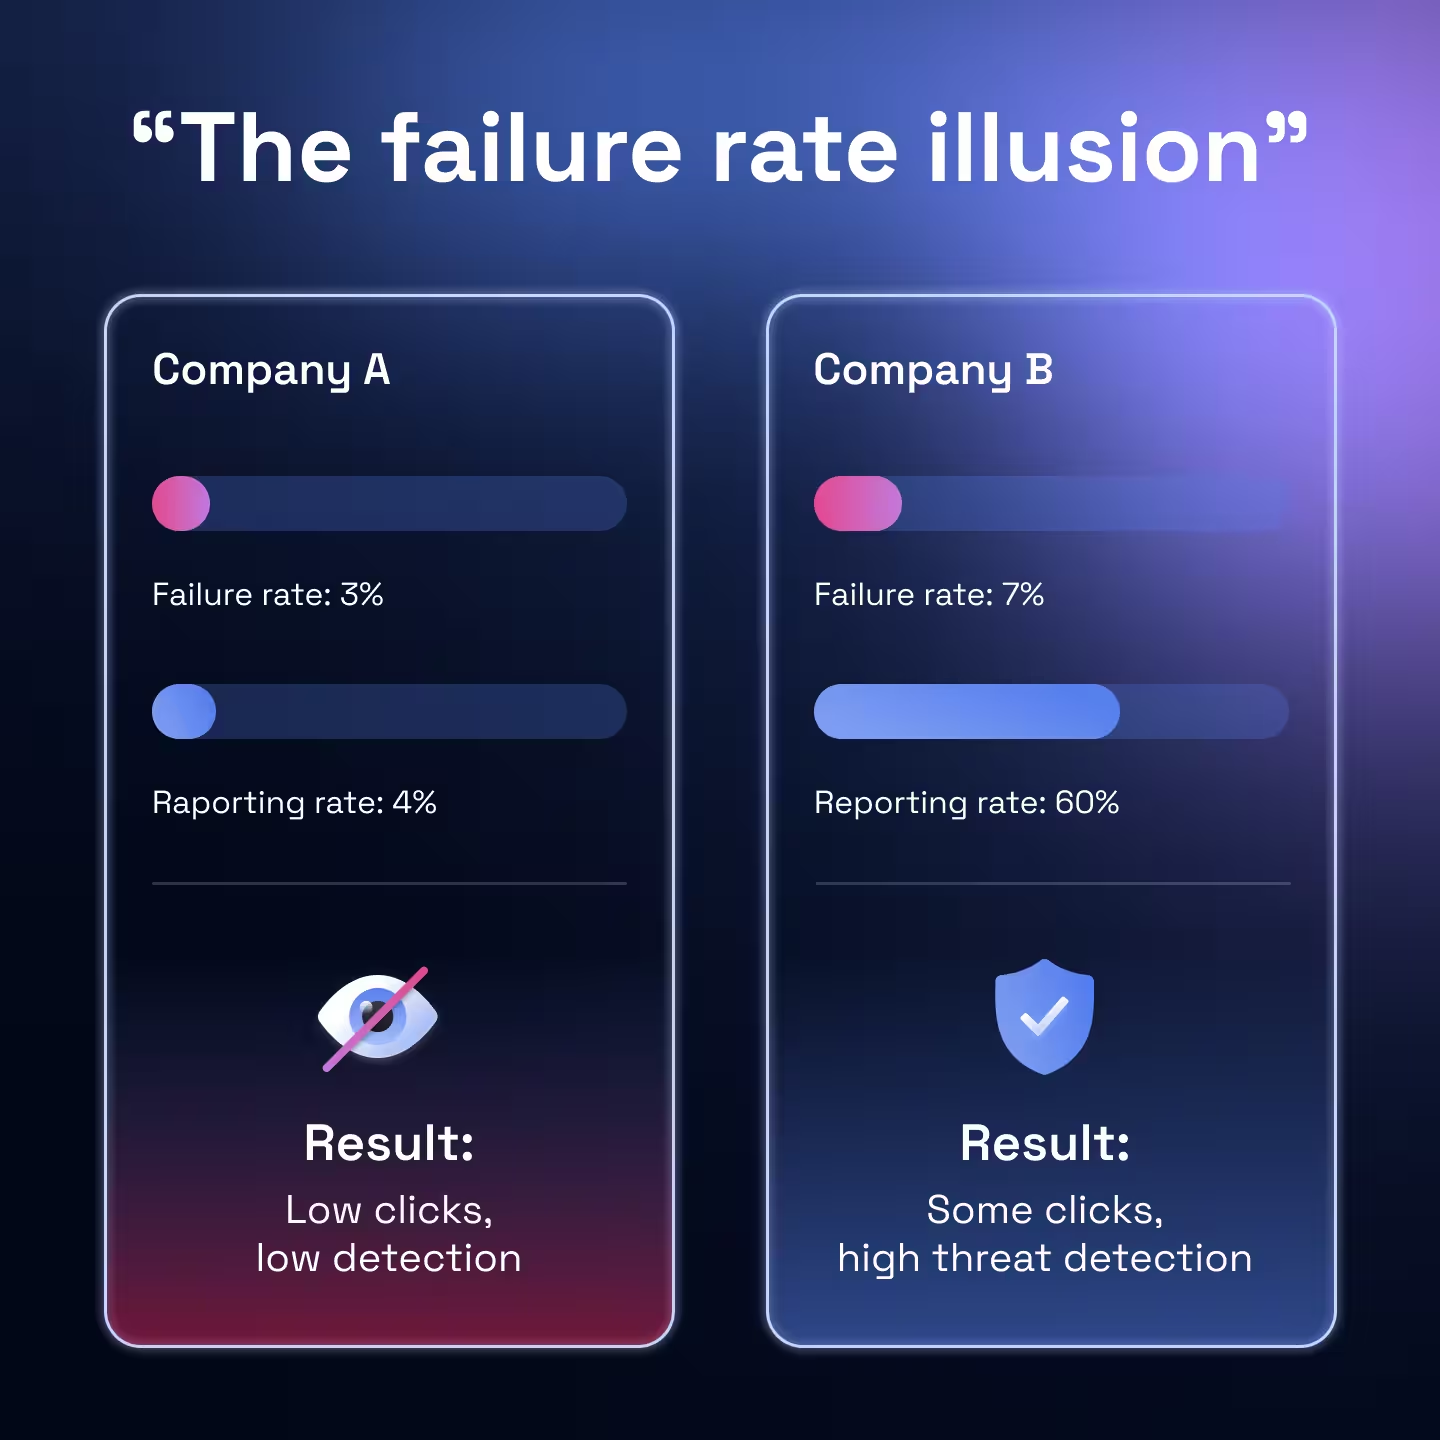
| Program A | 4% | 6% | Users rarely click but also rarely report threats |
| Program B | 7% | 65% | Some users still click, but many actively detect attacks |
At first glance, Program A appears stronger because it has the lower failure rate.
But from a security perspective, Program B is far more resilient.
When employees consistently report suspicious emails, they effectively become a distributed detection network for the security team.
A single reported phishing email can allow analysts to:
- Identify active campaigns early
- Remove malicious emails from other inboxes
- Prevent additional users from interacting with the attack
This behavior dramatically reduces the dwell time of phishing attacks inside an organization.
Failure rate still matters, but its real value comes from understanding it in combination with positive defensive behavior.
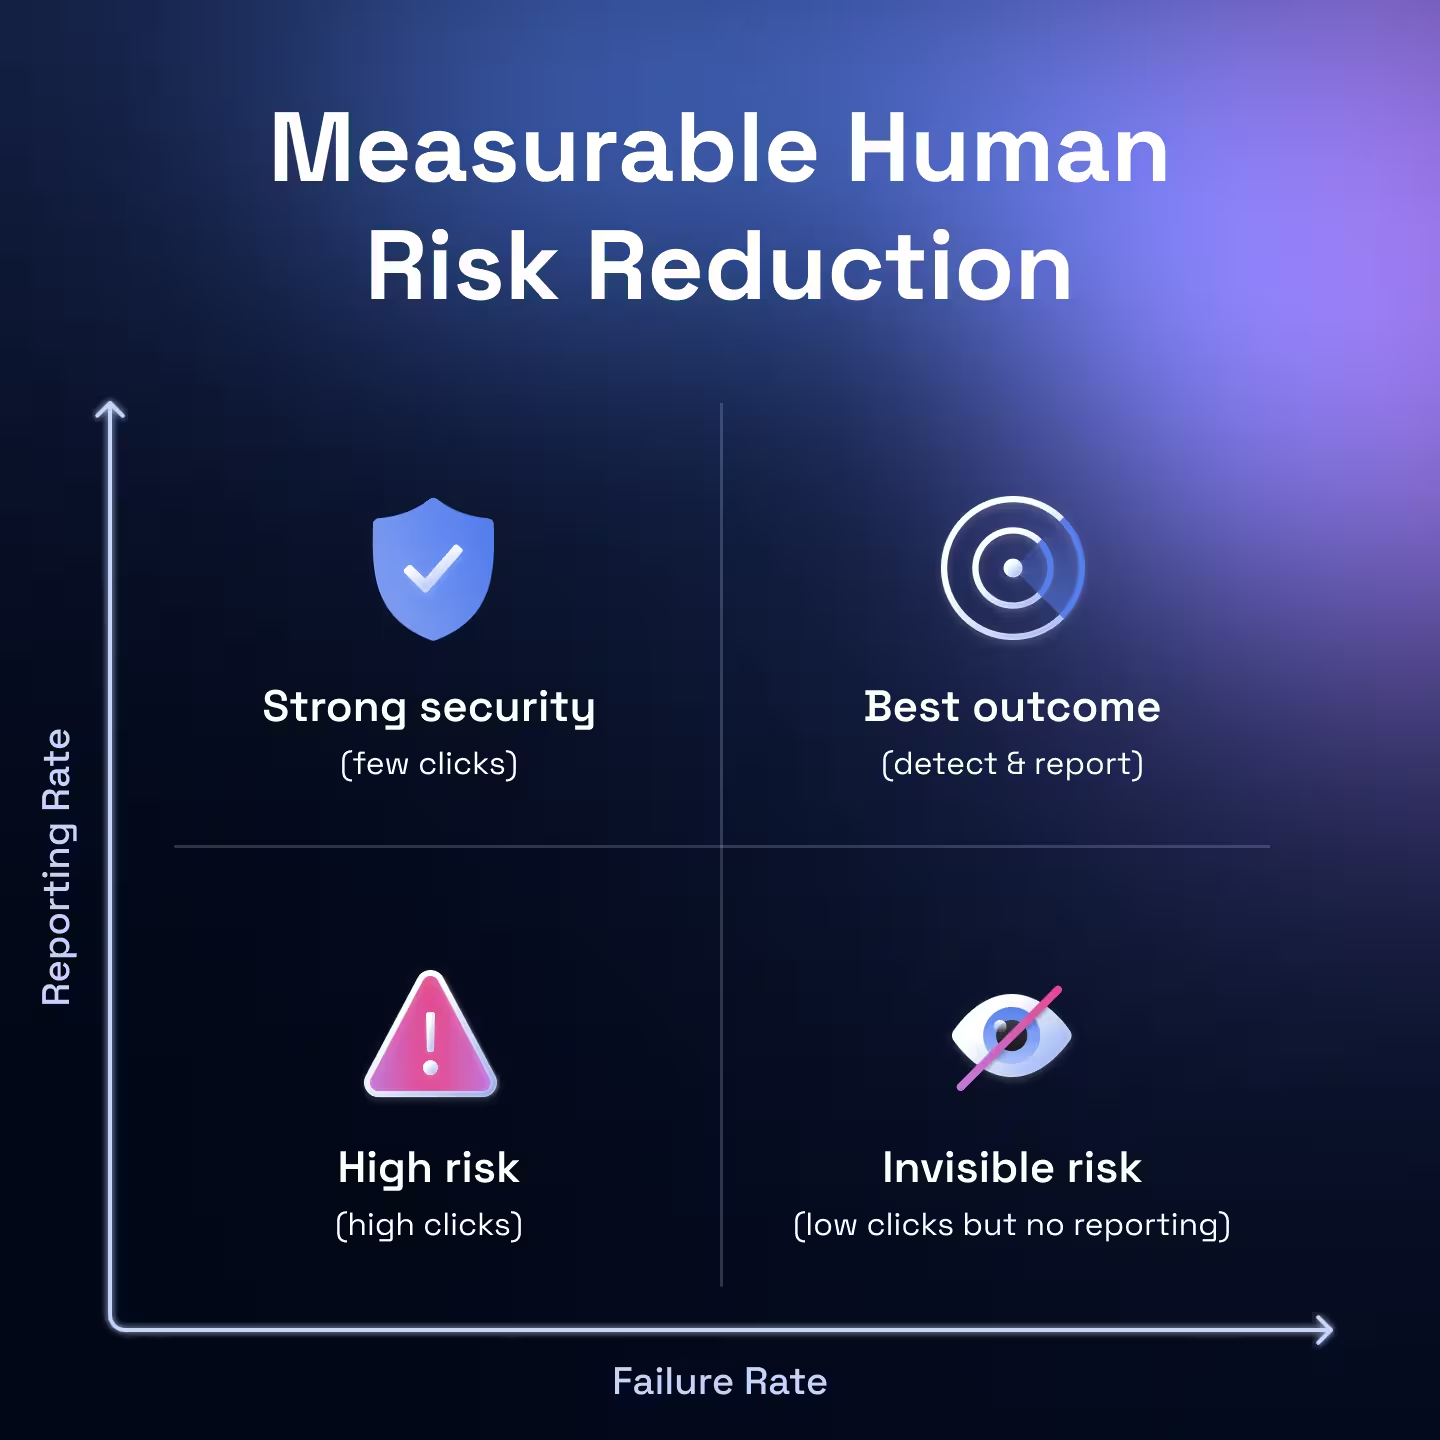
A strong awareness program therefore aims to achieve two outcomes simultaneously:
- Failure rates trend downward over time
- Reporting rates increase as employees learn to detect threats
When those two trends move together, it’s a strong signal that security awareness is translating into real-world behavior change.
What “good” actually looks like behaviorally
A good phishing failure rate isn’t just a number. It’s a byproduct of strong security behaviors across the organization.
When awareness programs are working well, you typically see a pattern emerge:
- Failure rates gradually decline over time
- Reporting rates increase
- Repeat clickers decrease
- Employees report suspicious emails faster
These behavioral signals matter more than hitting a specific benchmark. An organization that reduces its phishing failure rate from 18% to 7% over a year while simultaneously increasing reporting activity is showing clear evidence of improvement.
Victorinox saw the same traversal in Europe: failure rates fell from roughly 25% to below 5%, while its reporting button surfaced over 500 reports in a single incident (Victorinox case study).
What’s happening in these environments is a shift in employee behavior.
Instead of treating suspicious emails as background noise, employees begin to:
- Pause before interacting with unexpected messages
- Look for common phishing signals (sender anomalies, urgency, credential prompts)
- Report suspicious emails rather than ignoring them
Over time, this creates a powerful effect. Employees start functioning as a distributed detection network, identifying threats early and feeding signals back to the security team. This behavioral shift is ultimately what security awareness programs are trying to achieve. We map the full system that produces these behaviors in our guide to what actually reduces human cyber risk.
Reducing clicks in a simulation is a byproduct. The goal is to build a workforce that can recognize, question, and report suspicious activity in real-world situations.
When that behavior becomes consistent, failure rates tend to settle naturally into the low single digits, not because employees avoid tests but because they have developed stronger security instincts.
What failure rate should you report to leadership?
Report a target band, not a single number: 5-10% for a maturing program, trending toward 2-5%, always paired with reporting rate. The stronger management artifact is the maturity curve itself: where you started, where you are now, and both metrics moving in the right direction. A standalone failure rate invites exactly the benchmark traps above. Include your miss rate, the share of users who neither fail nor report, so leadership sees tested coverage rather than clicks alone. Reporting above 20% of simulations is the clearest sign of genuine behavior change, while traditional programs typically sit near 10% (Phishing Trends Report 2026).
How to interpret your phishing failure rate
Instead of focusing on a single “good” number, security leaders should evaluate phishing failure rate in context.
A strong awareness program typically shows three patterns over time:
| Signal | What it means |
|---|---|
| Failure rate trending downward | Employees are interacting with phishing emails less often |
| Reporting rate increasing | Employees are actively detecting threats |
| Repeat clickers declining | High-risk individuals are improving with targeted training |
When these trends appear together, it indicates that security awareness is changing real user behavior rather than just improving test results.
For most organizations, mature programs eventually stabilize around failure rates in the low single digits but the exact number matters less than the direction of change.
A company moving from 18% → 8% → 4% over two years is demonstrating far stronger progress than one that has sat at 5% for years without behavioral improvement.
A good phishing failure rate is not just low. It is part of a pattern where employees are increasingly recognizing and reporting suspicious messages. That’s the point where security awareness starts translating into real resilience against phishing attacks.
Next questions security leaders ask about security awareness
- How Do You Prove Security Awareness Is Working?
- We’re Running Security Awareness Training. Why Isn’t Risk Going Down?
- Repeat Offenders in Phishing: Here’s How We Train Them Out
Get more cybersecurity insights like this
- Subscribe to All Things Human Risk to get a monthly round up of our latest content
- Request a demo for a customized walkthrough of Hoxhunt
.avif)